What is a slow SQL query?

User interface performance
For web and mobile applications (here, let's talk only about them, not touching analytical workloads, background processing, and so on), engineers usually aim to have as few SQL queries per each HTTP(S) request as possible, and keep the execution time of those queries very low.
How much low?
Well, usually, we say that 1 ms is good enough for an SQL query duration, while 100 ms is worrisome. And 500-1000 ms is something that we definitely need to optimize, while 10 seconds is a total disaster.
Why so?
It's all dictated by our expectations for HTTP/HTTPS requests. When a user opens a web page or interacts with a mobile app, triggering API calls, we expect the server to respond fast. It is possible and makes sense to define some requirements for the speed of such a response. In an article "Response Times: The 3 Important Limits" published in 1993, Jakob Nielsen, a famous web usability consultant and human–computer interaction researcher, described the "0.1 / 1 / 10" rule for building well-performant interfaces:
DBLab Engine
Instant database branching with O(1) economics.
There are 3 main time limits (which are determined by human perceptual abilities) to keep in mind when optimizing web and application performance.
... The basic advice regarding response times has been about the same for thirty years:
- 0.1 second is about the limit for having the user feel that the system is reacting instantaneously, meaning that no special feedback is necessary except to display the result.
- 1.0 second is about the limit for the user's flow of thought to stay uninterrupted, even though the user will notice the delay. Normally, no special feedback is necessary during delays of more than 0.1 but less than 1.0 second, but the user does lose the feeling of operating directly on the data.
- 10 seconds is about the limit for keeping the user's attention focused on the dialogue. For longer delays, users will want to perform other tasks while waiting for the computer to finish ...
Where did the first number, 100 ms, come from? In the scientific study of processing speed or reaction time on cognitive tasks called "Mental chronometry", the duration of human reaction to events was analyzed:
Human response times on simple reaction time tasks are usually on the order of 200 ms. The processes that occur during this brief time enable the brain to perceive the surrounding environment, identify an object of interest, decide an action in response to the object, and issue a motor command to execute the movement. These processes span the domains of perception and movement, and involve perceptual decision making and motor planning. Many researchers consider the lower limit of a valid response time trial to be somewhere between 100 and 200 ms, which can be considered the bare minimum of time needed for physiological processes such as stimulus perception and for motor responses.
(You can find a lot of websites helping you test your own reaction time: example 1, example 2; don't forget that the time you measure consists of two phases, perception and reaction itself.)
In other words, events that last less than 100 ms are perceived as almost instant. This is exactly what we want from our servers – response time taking less than 100 ms.
SRT and slow SQL
For web and mobile applications, these numbers can be mapped to Server Response Time (SRT). For example, Google's PageSpeed Insights project considered SRT below 200 ms as good. And it's quite obvious that 1 second or more is quite slow.
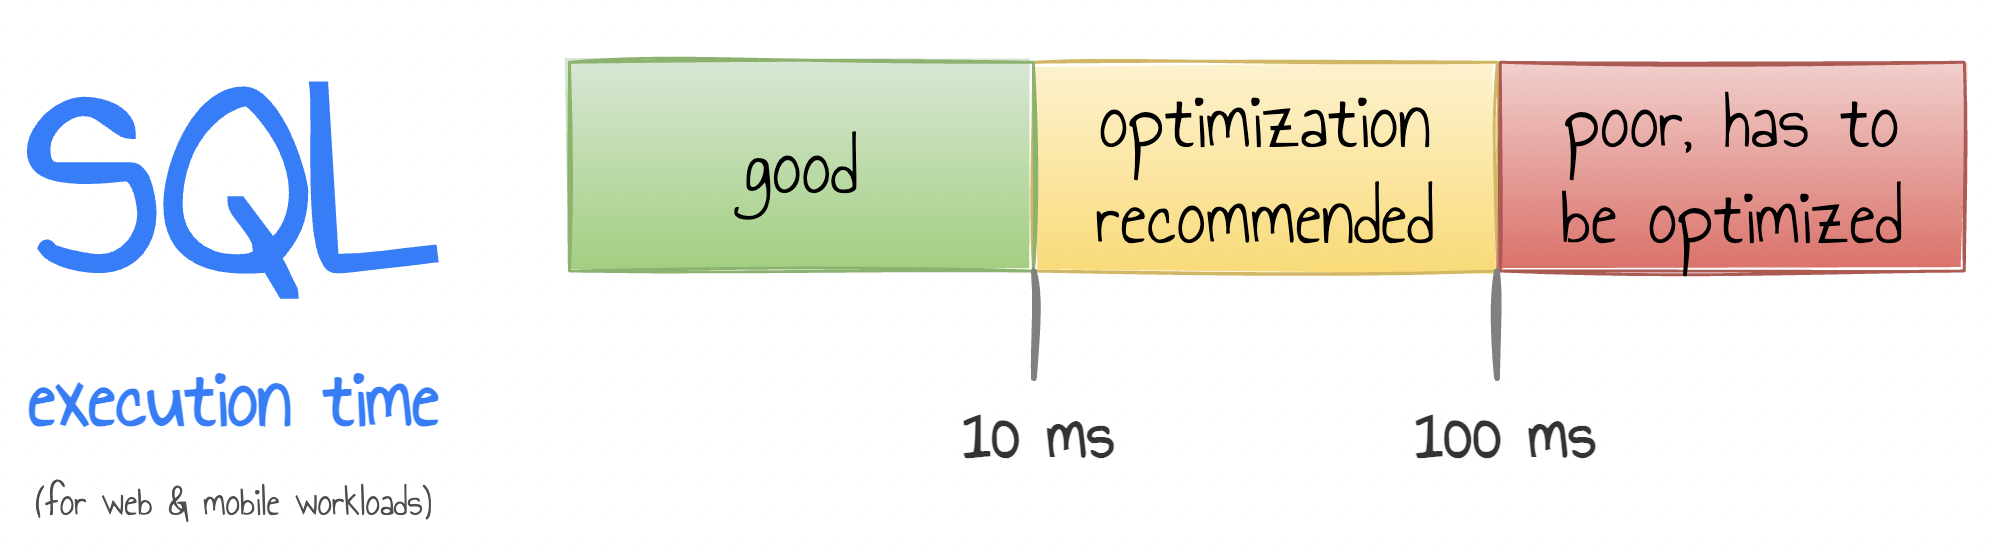
Assuming that any HTTP(S) request may imply a few SQL queries that do some specific work like retrieving several parts of the content from the database and writing some others, then, very roughly of course, we can draw the following expectation to SQL performance in the context of web and mobile applications:
- 10 ms or less – good performance
- 10-100 ms – optimization is recommended
- more than 100 ms – poor performance, optimization is needed
Slow queries in PostgreSQL
What is the average duration of SQL execution in your PostgreSQL? I'm not a big fan of averages (percentiles, histograms are much more powerful and helpful for system performance analysis), but knowing the averages, and especially historical data (in other words, a chart in the monitoring system), may still be very helpful. It can be a starting point for performance troubleshooting.
Unfortunately, in PostgreSQL, there is no direct way to check average query duration. Neither of the standard pg_stat_*** views would give you that (speaking of which, check out the great visualization of those made by Alexey Lesovsky from Data Egret: pgstats.dev).
The only ways to find the average SQL execution time (some name it "average latency") I know are:
- Using the pg_stat_statements extension, which is a standard de facto for query performance analysis:
– will give you that. For better results, it is worth taking two snapshots of
select sum(total_time) / sum(calls)
from pg_stat_statements;pg_stat_statementsand then do the math. One important note here: the extension does not store more thanpg_stat_statements.maxrecords, so if this setting is much lower than the number of possible query groups the database processes, the result can be quite off. With two snapshots, it's quite easy to check, though: all we need is to comparequeryidsets in both snapshots and see how many of them are gone and how many new arrived. The difference should be very low (a good idea: measure this "difference" in terms ofcallsvalues ortotal_time). - If pgBouncer is used, then average latencies can be found it its log. pgBouncer reports the stats every minute. Here is an example:
– this reads as: "318 transactions per second (TPS), 443 queries per second (QPS), ~58 KiB/s inbound traffic, ~119 KiB/s outbound, transaction average duration is 1076 microseconds ("μs", or "us"), query average duration is 454 μs, wait time – 546 μ". Another way to get statistics from pgBouncer is to connect to pgBouncer's so-called "admin console" and run
stats: 318 xacts/s, 443 queries/s, in 59883 B/s, out 122544 B/s, xact 1076 us, query 454 us, wait 548 usshow stats;. - If slow queries are logged (via setting
log_min_duration_statement), this may be a good way to learn something too. Although, it is usually not recommended to log all queries (log_min_duration_statement = 0) because this can quickly become a bottleneck. Quite often, people use values like1sor500msforlog_min_duration_statement, so we see only "the tip of the iceberg" (although, the "worst" one – the least performance queries), so we cannot really calculate the real averages. But still, we can see trends. For PostgreSQL log analysis, good old pgBadger is still a thing. - Finally, some application-side monitoring systems implement SQL query analysis, normalizing and aggregating SQL queries similarly to pg_stat_statements or pgBadger and providing various statistics, usually including average SQL duration. I'm not aware of any free tool of such kind, though. And it is always worth keeping in mind that such analysis, performed on the client-side, involves network latencies – time spent in network is added to the pure SQL processing time, so we analyze the sum of them.
Summary
I hope this post was helpful for the understanding of the reasons behind our target timing for the SQL query duration for web and mobile applications. The obvious advice is to learn the latencies, hunt for slow queries, and keep the SQL duration below 10ms for the most critical requests.

DBLab Engine
Instant database branching with O(1) economics.