It is well-known that having an extra index leads to certain types of overhead:
- so-called write amplification, slowing odwn INSERTs and UPDATEs (DELETEs are not affected):
- not only writes are slowed down, but index changes are written to WAL, increasing its volume,
- thus, backups are also affected,
- and physical replication as well, more needs to be replicated;
- (a very obvious one!) extra disk space is used;
- overhead in memory – space in the buffer pool and page cache, occupied by index pages.
But it is much less known that extra indexes slow down SELECTs, and might even cause performance cliffs. Let's explore it.
Unexpected: the planner locks all indexes
Let's create a simple table and 20 indexes on it, and remember the PID of this session:
test=# create table test(i int8);
CREATE TABLE
test=# do $$
begin
  for i in 1..20 loop
    execute 'create index on test(i)';
  end loop;
end;
$$;
DO
Now let's remember the PID of this session, and perform an EXPLAIN for a simple query in a transaction, not closing the transaction:
test=# select pg_backend_pid(); begin; explain select from test where i = 0;
 pg_backend_pid
----------------
        2961644
(1 row)

BEGIN
                                 QUERY PLAN
----------------------------------------------------------------------------
 Bitmap Heap Scan on test  (cost=1.34..9.56 rows=11 width=0)
   Recheck Cond: (i = 0)
   ->  Bitmap Index Scan on test_i_idx19  (cost=0.00..1.34 rows=11 width=0)
         Index Cond: (i = 0)
(4 rows)

test=*#
(EXPLAIN here )
In another session, let's look at the locks, acquired by the first session:
test=# select
  locktype,
  relation::regclass,
  pid,
  mode,
  granted,
  fastpath
from pg_locks
where
  pid = 2961907
  and locktype <> 'virtualxid'
;
 locktype |   relation   |   pid   |      mode       | granted | fastpath
----------+--------------+---------+-----------------+---------+----------
 relation | test_i_idx14 | 2961907 | AccessShareLock | t       | t
 relation | test_i_idx13 | 2961907 | AccessShareLock | t       | t
 relation | test_i_idx12 | 2961907 | AccessShareLock | t       | t
 relation | test_i_idx11 | 2961907 | AccessShareLock | t       | t
 relation | test_i_idx10 | 2961907 | AccessShareLock | t       | t
 relation | test_i_idx9  | 2961907 | AccessShareLock | t       | t
 relation | test_i_idx8  | 2961907 | AccessShareLock | t       | t
 relation | test_i_idx7  | 2961907 | AccessShareLock | t       | t
 relation | test_i_idx6  | 2961907 | AccessShareLock | t       | t
 relation | test_i_idx5  | 2961907 | AccessShareLock | t       | t
 relation | test_i_idx4  | 2961907 | AccessShareLock | t       | t
 relation | test_i_idx3  | 2961907 | AccessShareLock | t       | t
 relation | test_i_idx2  | 2961907 | AccessShareLock | t       | t
 relation | test_i_idx1  | 2961907 | AccessShareLock | t       | t
 relation | test_i_idx   | 2961907 | AccessShareLock | t       | t
 relation | test         | 2961907 | AccessShareLock | t       | t
 relation | test_i_idx16 | 2961907 | AccessShareLock | t       | f
 relation | test_i_idx17 | 2961907 | AccessShareLock | t       | f
 relation | test_i_idx19 | 2961907 | AccessShareLock | t       | f
 relation | test_i_idx15 | 2961907 | AccessShareLock | t       | f
 relation | test_i_idx18 | 2961907 | AccessShareLock | t       | f
(21 rows)
As we can see, the first session locked the table with AccessShareLock, but it also locked all its indexes. This might look unexpected – 21 heavy locks in total.
Additionally, let's notice that only first 16 locks have fastpath set to true, five more have false in there.
// TBD explain what's happening // https://github.com/postgres/postgres/blob/f21e51ea73973f87715581fc68a6caf97f56505e/src/include/storage/proc.h#L85 // pg18: allows adjusting it https://github.com/postgres/postgres/blob/4e1fad37872e49a711adad5d9870516e5c71a375/src/include/storage/proc.h#L91C1-L91C92
Benchmark
Using the Postgres.AI assistant, we conducted a series of traditional pgbench benchmarks to analyze impact of over-indexing on the SELECT queries: https://postgres.ai/chats/01921029-781b-789c-9076-31c1f87ab649.
The key idea was to run pgbench with -S ("SELECTs only") multiple times, add one more index at each step, testing with up to 20 additional indexes on pgbench_accounts. In this research we used Postgres 16 running on small machines in GCP, n2-standard-8 (8 vCPUs, 64 GiB RAM).
Here is the full config for the first series of experiments, defined in the format understood by the Postgres.AI assistant:
{
  "POSTGRES_VERSION": "16",
  "SERVER_TYPE": "n2-standard-8",
  "VOLUME_SIZE": "100",
  "TEST_RUNS": {
    "index_01": {
      "pre_sql": "create index on pgbench_accounts (aid);",
      "workload_pgbench": "pgbench -c 8 -j 8 -S -P 10 -T 300 -R 5000 -r"
    },
    "index_02": {
      "pre_sql": "create index on pgbench_accounts (aid);",
      "workload_pgbench": "pgbench -c 8 -j 8 -S -P 10 -T 300 -R 5000 -r"
    },
    "index_03": {
      "pre_sql": "create index on pgbench_accounts (aid);",
      "workload_pgbench": "pgbench -c 8 -j 8 -S -P 10 -T 300 -R 5000 -r"
    },
    ... // omitted: steps to add 4th..19th extra indexes
    "index_20": {
      "pre_sql": "create index on pgbench_accounts (aid);",
      "workload_pgbench": "pgbench -c 8 -j 8 -S -P 10 -T 300 -R 5000 -r"
    }
  }
}
With option -r, pgbench reports the latencies in the end, as we can double-check in the artifact set collected for the benchamarks. For example, for the first series of experiments, where we limited TPS by 5000 (-R 5000), for the last iteration, where we had 20 extra indexes, we had:
[index_20|workload_pgbench] 2024-09-20 18:06:25 number of transactions actually processed: 1500352
[index_20|workload_pgbench] 2024-09-20 18:06:25 number of failed transactions: 0 (0.000%)
[index_20|workload_pgbench] 2024-09-20 18:06:25 latency average = 0.283 ms
[index_20|workload_pgbench] 2024-09-20 18:06:25 latency stddev = 0.251 ms
[index_20|workload_pgbench] 2024-09-20 18:06:25 rate limit schedule lag: avg 0.091 (max 9.729) ms
[index_20|workload_pgbench] 2024-09-20 18:06:25 initial connection time = 45.322 ms
[index_20|workload_pgbench] 2024-09-20 18:06:25 tps = 5001.918903 (without initial connection time)
[index_20|workload_pgbench] 2024-09-20 18:06:25 statement latencies in milliseconds and failures:
[index_20|workload_pgbench] 2024-09-20 18:06:25          0.001           0  \set aid random(1, 100000 * :scale)
[index_20|workload_pgbench] 2024-09-20 18:06:25          0.191           0  SELECT abalance FROM pgbench_accounts WHERE aid = :aid;
– indeed, we had only a single SELECT.
The first series of pgbench runs, latency was slowly growing, with a noticeable step at the moment, when 15th extra index was created:
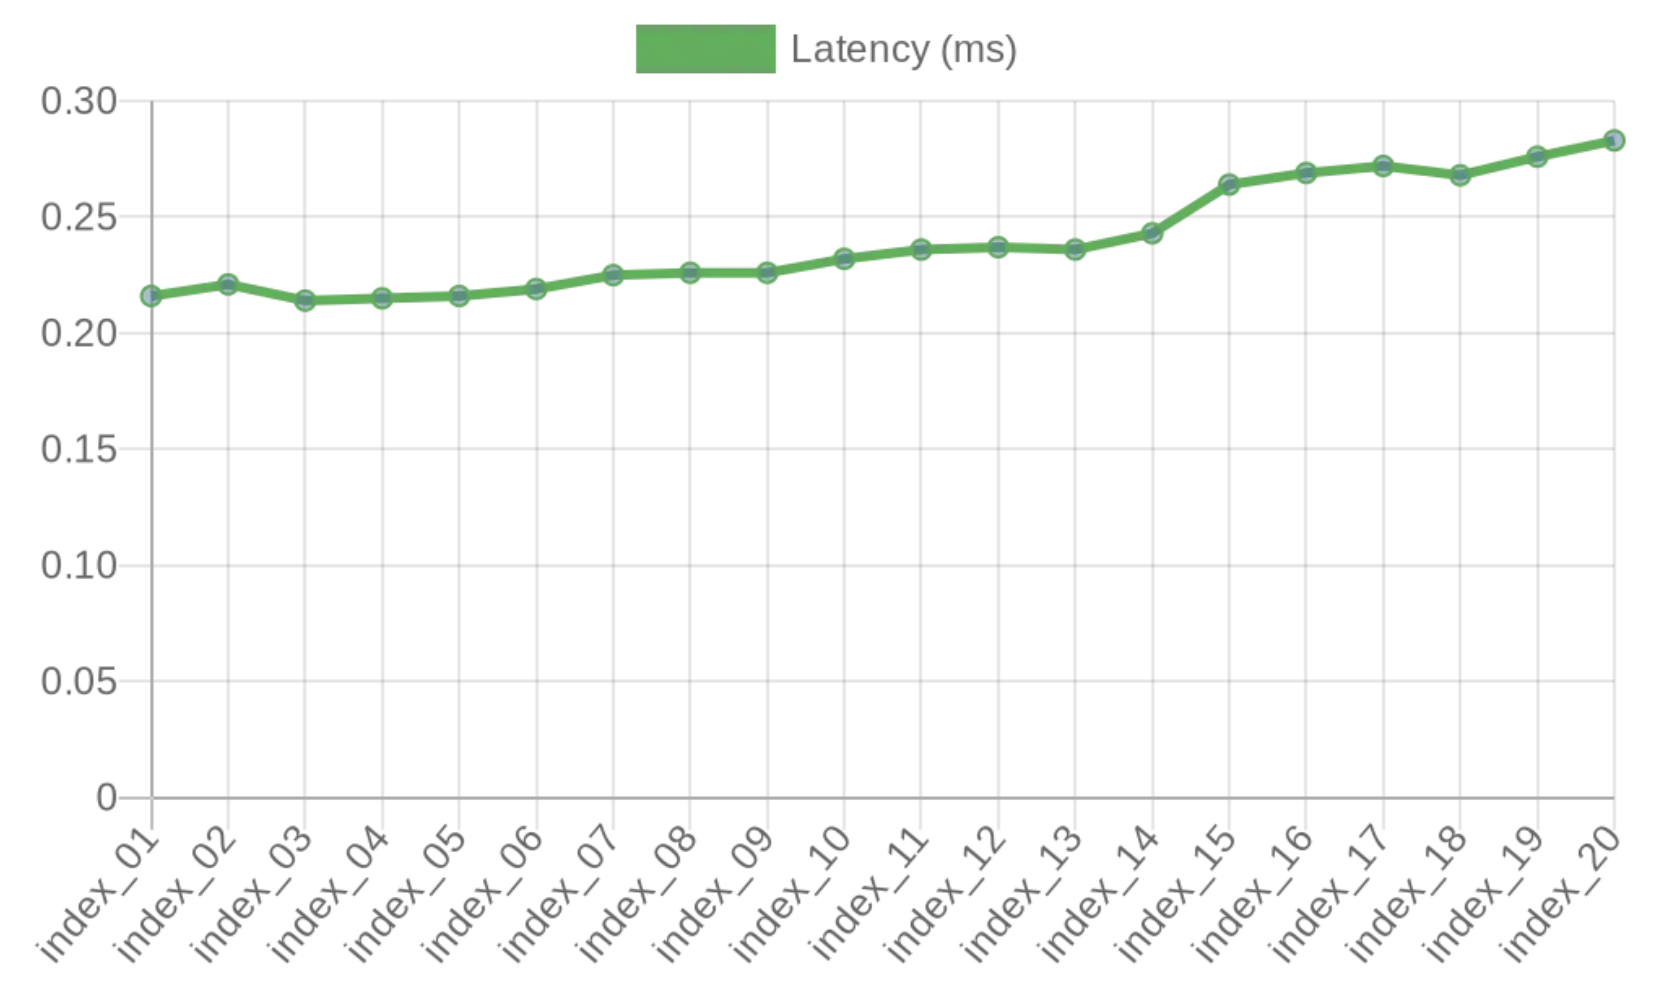
Why the step at 15th extra index? 15 extra indexes, with the table itself and its primary key – this gives overall number of relations locked 17, exceeding FP_LOCK_SLOTS_PER_BACKEND.
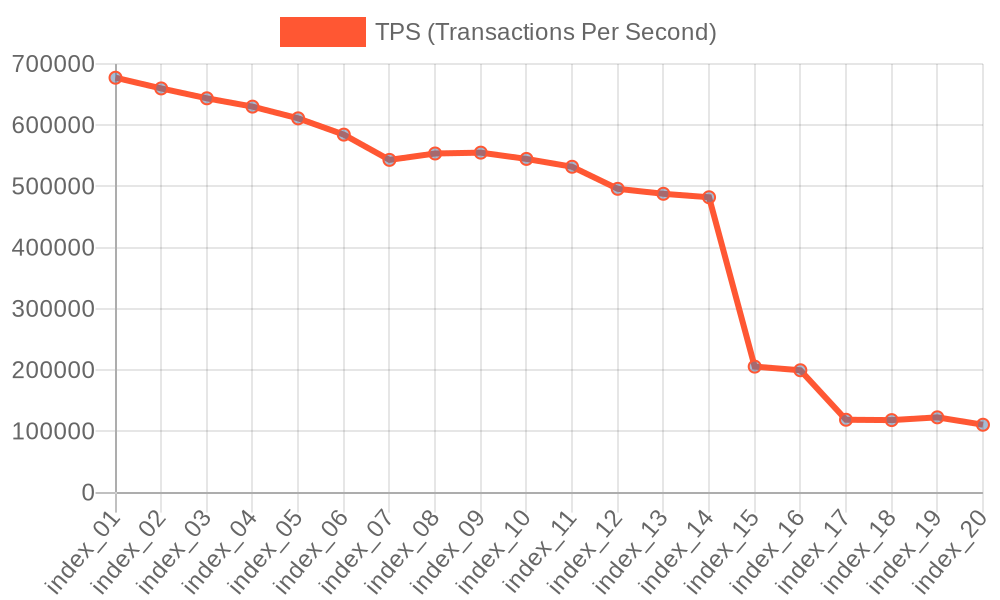
However, if we repeat the experiment on a server with 96 vCPUs, the picture changes drastically (re-test details are available here):
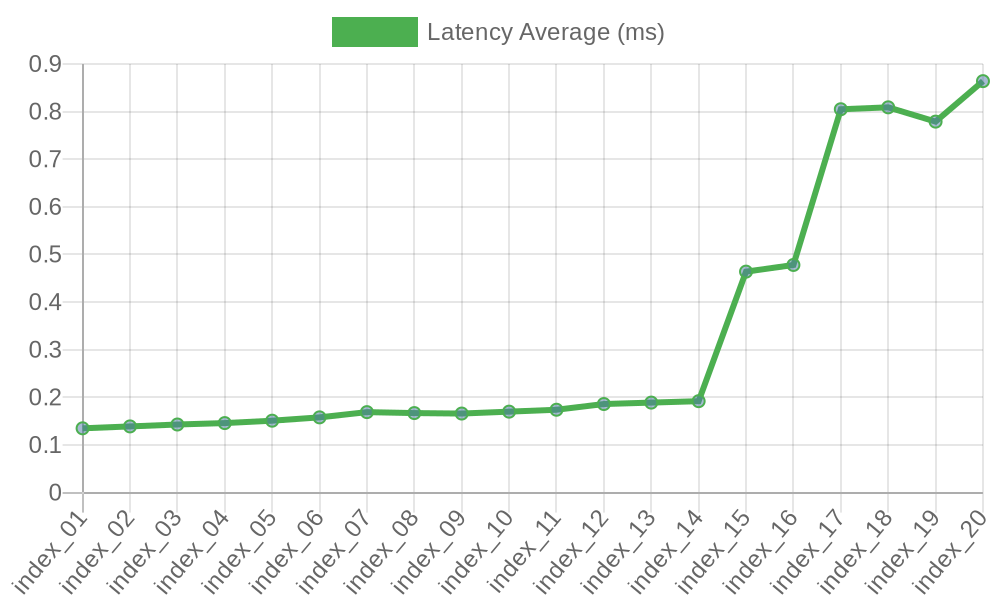
As a result, we see a significant drawdown of TPS:


Explore it further
We encourage you to experiment with the interactive AI assistant provided in this post, explore how these findings apply to your specific use cases, and share your experiences with the wider Postgres community.