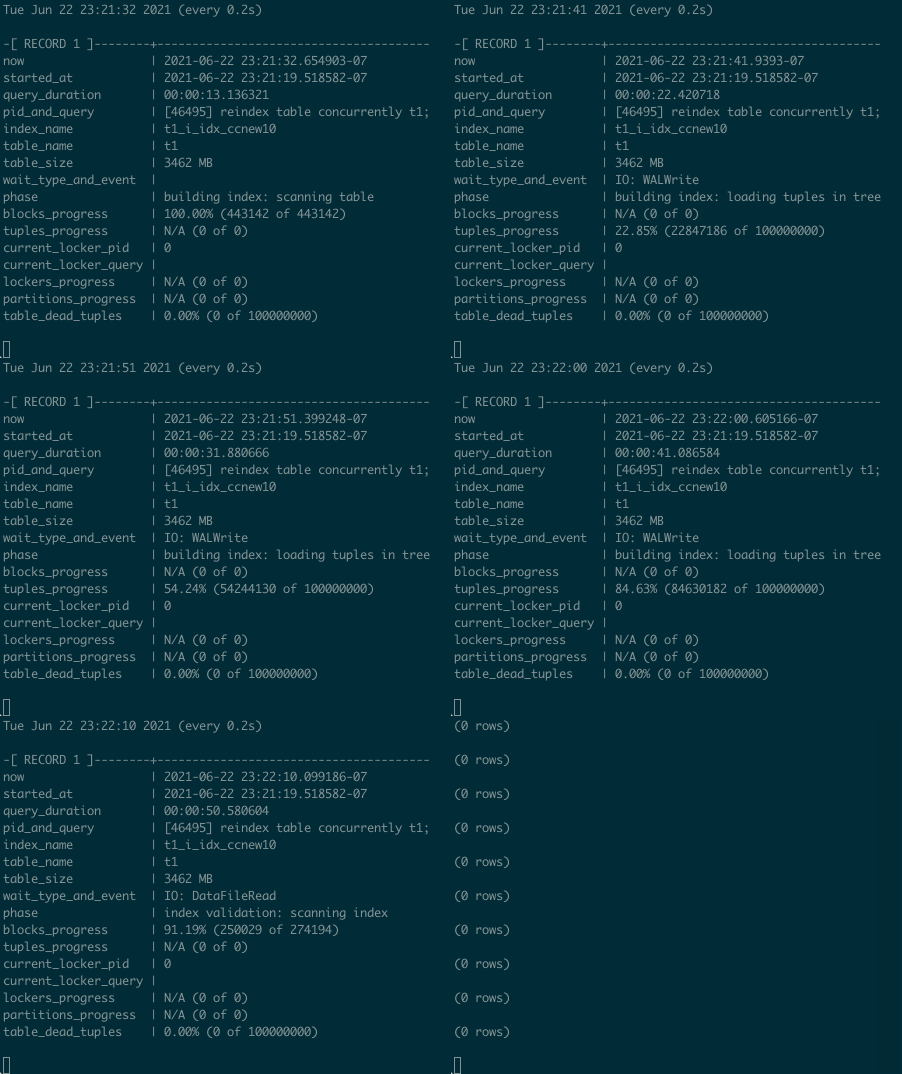
How to monitor CREATE INDEX / REINDEX progress in Postgres 12+
To monitor the progress of long-running index building or rebuilding, you can use this query:
select
   now(),
   query_start as started_at,
   now() - query_start as query_duration,
   format('[%s] %s', a.pid, a.query) as pid_and_query,
   index_relid::regclass as index_name,
   relid::regclass as table_name,
   (pg_size_pretty(pg_relation_size(relid))) as table_size,
   nullif(wait_event_type, '') || ': ' || wait_event as wait_type_and_event,
   phase,
   format(
           '%s (%s of %s)',
           coalesce((round(100 * blocks_done::numeric / nullif(blocks_total, 0), 2))::text || '%', 'N/A'),
           coalesce(blocks_done::text, '?'),
           coalesce(blocks_total::text, '?')
   ) as blocks_progress,
   format(
           '%s (%s of %s)',
           coalesce((round(100 * tuples_done::numeric / nullif(tuples_total, 0), 2))::text || '%', 'N/A'),
           coalesce(tuples_done::text, '?'),
           coalesce(tuples_total::text, '?')
   ) as tuples_progress,
   current_locker_pid,
   (select nullif(left(query, 150), '') || '...' from pg_stat_activity a where a.pid = current_locker_pid) as current_locker_query,
   format(
           '%s (%s of %s)',
           coalesce((round(100 * lockers_done::numeric / nullif(lockers_total, 0), 2))::text || '%', 'N/A'),
           coalesce(lockers_done::text, '?'),
           coalesce(lockers_total::text, '?')
   ) as lockers_progress,
   format(
           '%s (%s of %s)',
           coalesce((round(100 * partitions_done::numeric / nullif(partitions_total, 0), 2))::text || '%', 'N/A'),
           coalesce(partitions_done::text, '?'),
           coalesce(partitions_total::text, '?')
   ) as partitions_progress,
   (
      select
         format(
                 '%s (%s of %s)',
                 coalesce((round(100 * n_dead_tup::numeric / nullif(reltuples::numeric, 0), 2))::text || '%', 'N/A'),
                 coalesce(n_dead_tup::text, '?'),
                 coalesce(reltuples::int8::text, '?')
         )
      from pg_stat_all_tables t, pg_class tc
      where t.relid = p.relid and tc.oid = p.relid
   ) as table_dead_tuples
from pg_stat_progress_create_index p
        left join pg_stat_activity a on a.pid = p.pid
order by p.index_relid
; -- in psql, use "\watch 5" instead of semicolon
The same query, in a better formatted form.
How this query works:
-
The basis of it is
pg_stat_progress_create_indexadded in Postgres 12. -
The documentation also has a list of
CREATE INDEXphases. As you can see from the table provided in the docs, advanced variant,CREATE INDEX CONCURRENTLY/REINDEX CONCURRENTLY(a.k.a. CIC and RC), which takes longer but acts in a non-blocking fashion suitable for loaded production systems, has more phases. The current phase is presented in the column "phase" of the output. -
Index name (a temporary one in case of CIC/RC), table name are presented (using the useful trick to convert OIDs to names – note, e.g.,
index_relid::regclass as index_name). Additionally, the table size which is essential to form expectations of overall duration – the bigger the table is, the longer the index creation is going to take. -
pg_stat_activity(pgsa) provides a lot of additional useful information:- PID of Postgres backend
- actual SQL query used
- the moment when the work has started (
query_start), allowing us to understand the elapsed time (query_duration) wait_event_type&wait_eventto understand what the process is currently waiting on- it also used (in a separate sub-query) to get the information of the session that blocks our process, when such an
event occurs (
current_locker_pid,current_locker_query)
-
Function
format(...)is very useful to consolidate data in convenient form without having to worry aboutNULLs, that would be a problem if we used a regular concatenation withoutcoalesce(...). -
However, in certain cases we use
coalesce(...)just to put special symbols if the value is missing (IS NULL) – e.g., "?" or "N/A". -
Another interesting trick is combination of
coalesce(...)andnullif(...). The latter allows us to avoid division by zero errors (replacing0withNULL, making the division result alsoNULL), while the former, again, is used to substitute resultingNULLwith some non-empty value (in this case, 'N/A').
When executed in psql, it can be convenient to use \watch [seconds] to run this report in loop and observe progress
live:
