Checkup
Checkup is an automated health check tool for PostgreSQL. It analyzes your database for known problems and produces a prioritized report with actionable fixes.
Checkup works in two modes:
- CLI mode (
npx postgresai checkup) — connects directly to your database and runs 11 checks. No Docker required. - Monitoring stack mode — the reporter component inside the full monitoring stack runs automatically on a daily schedule, analyzing collected metrics to generate 23 checks including query analysis, bloat estimates, and wait events.
CLI checks
The CLI runs 11 checks organized in 5 groups.
Version and configuration
A002 — Postgres major version. Reports the major version and checks whether it is still supported by the PostgreSQL community. Running an unsupported major version means no security patches.
A013 — Postgres minor version. Checks whether you are on the latest minor release. Minor releases contain critical bug fixes and security patches — lagging behind is a common source of preventable outages.
A003 — Postgres settings. Collects all postgresql.conf settings so they can be analyzed for known misconfigurations (e.g., shared_buffers still at the 128 MB default, random_page_cost not tuned for SSDs).
A007 — Altered settings. Shows which settings have been changed from their defaults. Helps identify intentional tuning vs. accidental changes and catch settings that conflict with each other.
A004 — Cluster information. Collects cluster-level metadata: data directory, database sizes, tablespace layout, and replication state. Useful for understanding the physical layout of the installation.
Monitoring readiness
D004 — pg_stat_statements and pg_stat_kcache settings. Verifies that pg_stat_statements is installed and configured correctly. Without it, query-level analysis (in dashboards and future checkup checks) is not possible. Also checks for pg_stat_kcache if available.
Autovacuum
F001 — Autovacuum: current settings. Collects all autovacuum-related settings (global and per-table overrides). Identifies common misconfigurations such as autovacuum disabled on specific tables, overly conservative thresholds, or too few workers for the workload.
Memory
G001 — Memory-related settings. Analyzes shared_buffers, work_mem, maintenance_work_mem, effective_cache_size, and other memory settings relative to the available system RAM. Flags obvious problems like shared_buffers set to less than 25% of RAM or work_mem set too high for the number of connections.
Index health
H001 — Invalid indexes. Finds indexes that are marked as invalid — typically from a failed CREATE INDEX CONCURRENTLY that was never cleaned up. Invalid indexes consume disk space and slow down writes but are never used for queries.
H002 — Unused indexes. Lists indexes with zero scans since the last statistics reset. Each unused index wastes disk space and adds overhead to every INSERT, UPDATE, and DELETE. The report includes the index definition and size, and notes whether the index supports a foreign key constraint (in which case it should not be dropped).
H004 — Redundant indexes. Finds indexes that are fully covered by another index on the same table. For example, an index on (customer_id) is redundant if an index on (customer_id, created_at) also exists — the composite index can serve both single-column and multi-column lookups.
Monitoring stack checks
Install managed monitoring from PostgresAI Console to run all checks daily, track issues over time, and resolve them with AI-assisted tools — no self-hosting required.
When running inside the full monitoring stack, the reporter generates 12 additional checks by analyzing metrics collected by pgwatch and VictoriaMetrics. These checks are not available in the CLI because they require historical metric data.
Bloat
F004 — Heap bloat (estimated). Estimates table bloat using pgstattuple-style heuristics from collected metrics. Reports wasted space per table so you can prioritize VACUUM FULL or pg_repack targets.
F005 — Index bloat (estimated). Estimates B-tree index bloat. Bloated indexes waste disk and slow down scans — REINDEX CONCURRENTLY can fix them without downtime.
Query analysis
All query checks analyze pg_stat_statements data collected over the last 24 hours.
K001 — Globally aggregated query metrics. Total calls, rows, time, and I/O across all queries. Gives a high-level picture of workload volume and resource consumption.
K003 — Top queries by total time. The most important query check. Ranks queries by total_exec_time + total_plan_time to find the ones consuming the most database resources.
K004 — Top queries by temp bytes written. Queries spilling to disk via temporary files. These often need more work_mem or a query rewrite to avoid large sorts or hash joins.
K005 — Top queries by WAL generation. Queries generating the most write-ahead log. High WAL generation increases replication lag and backup size.
K006 — Top queries by shared blocks read. Queries causing the most physical disk reads — candidates for better indexes or larger shared_buffers.
K007 — Top queries by shared blocks hit. Queries hitting the buffer cache most. High hit counts with low execution time are normal; high hit counts with high time may indicate cache contention.
K008 — Top queries by shared blocks hit+read. Combined I/O pressure — useful for finding queries with the heaviest overall buffer usage regardless of cache hit ratio.
M001 — Top queries by mean execution time. Ranks by average latency per call. Complements K003 (total time) — a query called rarely but taking 10 seconds per call may not dominate K003 but will show up here.
M002 — Top queries by rows. Queries returning or affecting the most rows. Helps identify full table scans and bulk operations.
M003 — Top queries by I/O time. Queries spending the most time on disk I/O (blk_read_time + blk_write_time). Requires track_io_timing = on.
Wait events
N001 — Wait events grouped by type and query. Analyzes Active Session History (ASH) data to show which queries are waiting and what they are waiting on (CPU, IO, Lock, Client). Helps correlate wait pressure with specific queries.
How to run
One-time check (CLI)
npx postgresai checkup postgresql://user:password@host:5432/dbname
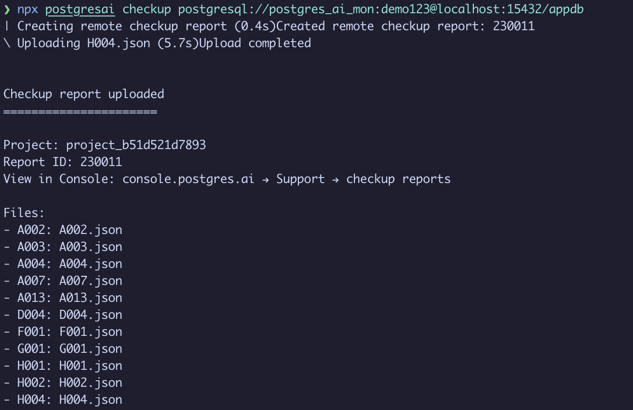
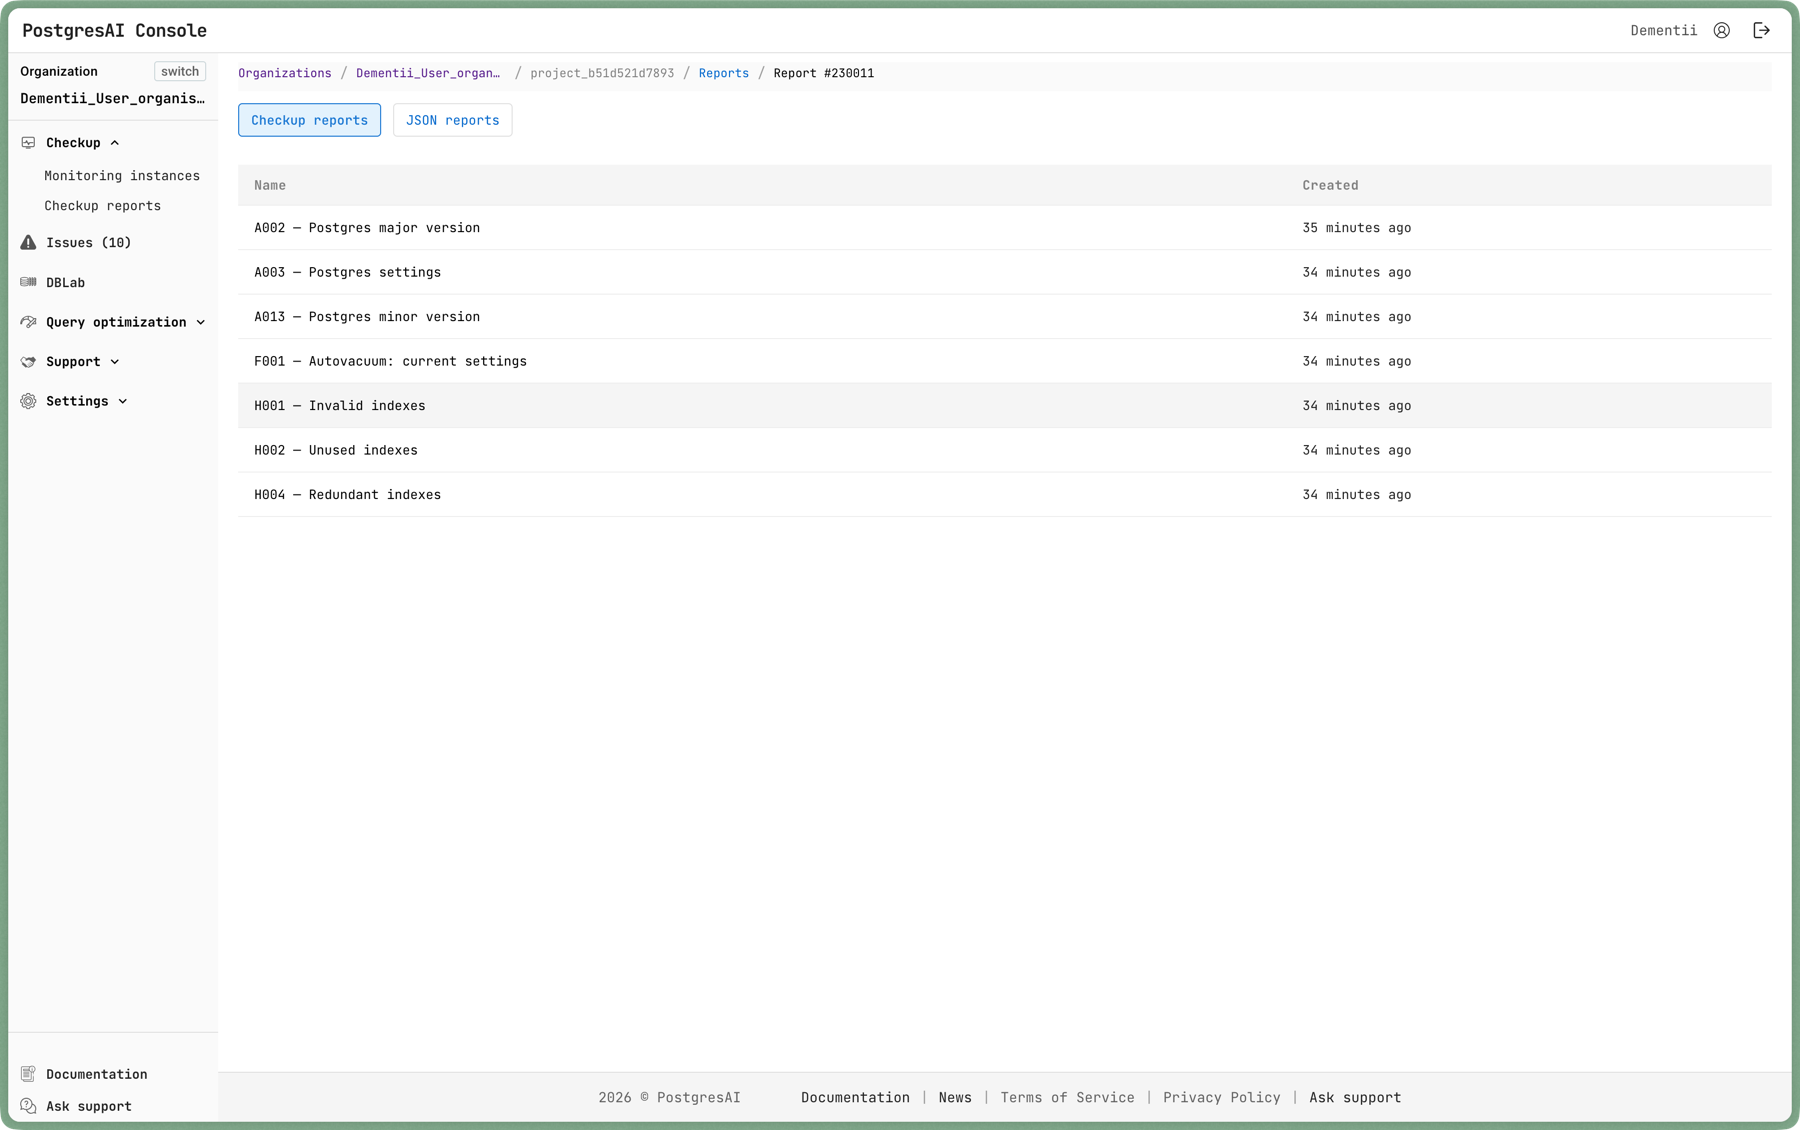
Results are uploaded to PostgresAI Console where you can browse each check:
Specific check
npx postgresai checkup --check-id H002 postgresql://user:password@host:5432/dbname
Output formats
# JSON for automation
npx postgresai checkup --json postgresql://...

# Markdown for reports
npx postgresai checkup --markdown postgresql://...
Report structure
Each report contains three sections:
- Observations — automatically collected data. This is raw diagnostic output for an expert DBA.
- Conclusions — what the observations mean, stated in plain English for engineers who are not DBA specialists.
- Recommendations — action items with specific SQL or configuration changes to fix the issues.
Safety
- Checkup is read-only. It does not modify your database.
- All queries use a statement timeout (default: 30 seconds).
- It works with a
pg_monitorrole — no superuser access needed. - No application data is accessed, only metadata and statistics.
Preparing a monitoring user
Create a dedicated user with the minimum required permissions:
CREATE USER postgres_ai_mon PASSWORD '****';
GRANT pg_monitor TO postgres_ai_mon;
Or use the CLI helper:
npx postgresai prepare-db postgresql://admin:password@host:5432/dbname
Connecting to dashboards
Checkup findings map directly to monitoring dashboards for deeper investigation:
| Checkup finding | Dashboard for investigation |
|---|---|
| Unused indexes (H002) | Aggregated index analysis, Single index analysis |
| Redundant indexes (H004) | Aggregated index analysis |
| Invalid indexes (H001) | Aggregated index analysis |
| Top queries (K003) | Query performance (top-N), Single query analysis |
| Heap bloat (F004) | Aggregated table analysis, Single table analysis |
| Index bloat (F005) | Aggregated index analysis, Single index analysis |
| Wait events (N001) | Wait event analysis |
| Autovacuum settings (F001) | Autovacuum and bloat |
| Memory settings (G001) | Node overview |
Next steps
- Quick Start — run your first checkup
- Dashboards — investigation workflows
- Issues — track findings over time
- Metrics reference — full list of collected metrics