Quick start
Get a prioritized health report for your PostgreSQL database in minutes.
Prerequisites
- Node.js 18+ (or use bunx instead of npx)
- Network access to a PostgreSQL 14+ database
- A connection string with credentials
pg_stat_statementsenabled for query-level checks (Checkup warns if missing)
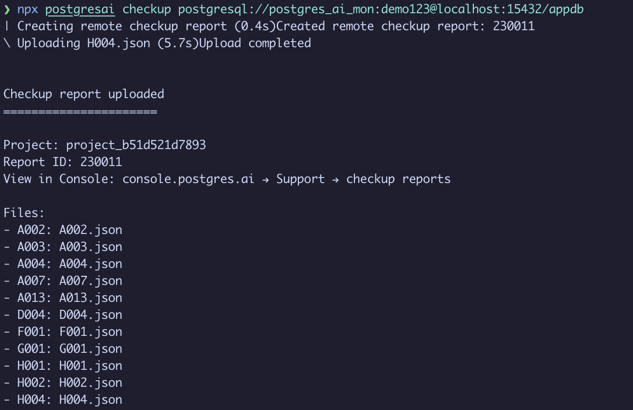
1. Run a checkup
npx postgresai checkup postgresql://user:password@host:5432/dbname
Or use environment variables:
PGPASSWORD=secret npx postgresai checkup postgresql://user@host:5432/dbname
To keep results local only (no upload):
npx postgresai checkup --no-upload postgresql://user@host:5432/dbname
No account required for local checks.
2. Review the report
The report is sorted by priority. Each finding includes:
- What the issue is (e.g., "5 unused indexes found")
- Why it matters (e.g., "Unused indexes waste disk space and slow down writes")
- How to fix it (actionable SQL included)
3. Run a specific check
Focus on a single check by ID:
npx postgresai checkup --check-id H002 postgresql://user:password@host:5432/dbname
See Checkup for the full list of available checks.
4. Prepare a monitoring user (optional)
Create a dedicated read-only role with the required permissions:
npx postgresai prepare-db postgresql://admin:password@host:5432/dbname
Preview the SQL before running it:
npx postgresai prepare-db --print-sql postgresql://admin:password@host:5432/dbname
5. Output formats
# JSON for scripts or AI tools
npx postgresai checkup --json postgresql://user:password@host:5432/dbname

# Markdown for sharing
npx postgresai checkup --markdown postgresql://user:password@host:5432/dbname
6. Install the full monitoring stack (optional)
For continuous monitoring with Grafana dashboards, install the full stack (requires Docker):
# Demo mode with sample data
npx postgresai mon local-install --demo

# With your database
npx postgresai mon local-install --db-url="postgresql://user:password@host:5432/dbname"
After installation, open Grafana at http://localhost:3000. See Dashboards for a guide to the available dashboards.
Common errors
| Error | Fix |
|---|---|
pg_stat_statements not enabled | Enable the extension: CREATE EXTENSION pg_stat_statements; and restart Postgres |
permission denied | Run prepare-db to create a monitoring role with the right permissions |
SSL negotiation failed | Add ?sslmode=require to your connection string |
connection refused | Check that Postgres is accepting connections from your IP |
See Troubleshooting for more.
What's next
The CLI gives you a one-time snapshot. For continuous monitoring with daily reports, query analysis, bloat tracking, and AI-assisted issue resolution, install managed monitoring from PostgresAI Console.
- Checkup — full list of checks and how to interpret results
- Dashboards — expert-level investigation workflows
- Issues — track findings over time with PostgresAI Console